

Let's get right to it. A business income worksheet is really just a simple spreadsheet where you keep track of all the money coming into your business and all the money going out. Think of it less like complicated accounting software and more like your financial command center. It gives you a clear, real-time picture of how profitable you are, without all the fuss.
Why You Genuinely Need an Income Worksheet

Look, managing the money side of a business can feel like a heavy lift. It's so easy for entrepreneurs to get caught up in the daily whirlwind and completely lose track of the bigger financial picture. That's exactly where a business income worksheet proves its worth. It’s not just about crunching numbers; it’s about finally getting some clarity and control over your company's financial health.
When you start diligently logging every dollar in and every dollar out, you turn what feels like a random jumble of numbers into information you can actually use. This simple habit helps you see your cash flow clearly, pinpoint which services are actually making you the most money, and catch those sneaky, unnecessary costs before they grow into major problems.
Get a Clear View of Your Finances
Keeping your worksheet updated gives you a constant pulse on how your business is doing. You don't have to wait for your accountant to send over a report at the end of the month or quarter; you can see exactly where you stand, right now. This kind of immediate feedback is absolutely vital for making smart, quick decisions.
For instance, a freelance graphic designer I know started tracking her projects this way. She quickly realized her "logo design" gigs had way better profit margins than her "social media graphics" packages. Armed with that knowledge, she shifted her marketing to chase more of the work that was actually paying the bills.
The real magic of a business income worksheet is how it demystifies your finances. It swaps guesswork for hard data, putting you in the driver's seat to make strategic moves that build real, sustainable growth.
Make Smarter Decisions About Spending
Your worksheet is also your best spending watchdog. Once you start categorizing every single expense—from software subscriptions to client coffee meetings—you'll start to see patterns. You might realize you’re paying for a tool you barely use, or that a certain ad campaign just isn't bringing in the customers you thought it would.
This detailed view is also a key part of protecting your business from risk. Having a solid record of your income and expenses is a cornerstone of good risk management. For more on protecting your operations, our guide on business insurance basics is a great resource for small business owners.
Set Yourself Up for Success
There are roughly 665 million entrepreneurs across the globe, so the competition is intense. The hard truth is that over two-thirds of new startups don't make it past their first decade, and poor financial management is one of the top reasons why.
Simply keeping good records with a detailed income worksheet drastically improves your odds. It forces you to make informed decisions and helps keep you on the right side of the tax man, setting a strong foundation for not just surviving, but thriving.
Building Your First Business Income Worksheet
Alright, enough with the theory. Let's get practical and build your first business income worksheet. You don't need to spend a dime on fancy software for this. A basic spreadsheet tool like Google Sheets or Microsoft Excel has all the power you need to create a financial command center for your business.
We're about to roll up our sleeves and build a reusable template. The goal here isn't to become a CPA overnight; it's to develop a simple, powerful habit that gives you a real-time pulse on your finances.
Setting Up Your Essential Columns
First things first: open a new, blank spreadsheet. We're going to create the core columns that will capture every transaction your business makes. Think of these as the foundation of your entire system.
Go ahead and label your columns with the following headers, from left to right:
- Date: When did the transaction happen? This is crucial for understanding your cash flow over specific periods.
- Description: A short, clear note about the transaction. Don't just put "Client Payment." Be specific, like "Logo Design – Smith Co." or "Monthly Web Hosting." You'll thank yourself later.
- Income/Expense: Is this money coming in or going out? A simple dropdown or text field to classify each entry.
- Category: This is where the real insight comes from. Assigning a category like "Software Subscription," "Consulting Fees," or "Office Supplies" helps you see exactly where your money is going.
- Amount: The dollar value. My personal tip: keep income as positive numbers and expenses as negative numbers. It makes the math so much easier.
- Running Total: This column will automatically calculate your real-time profit or loss as you add entries. More on this in a moment.
This simple structure immediately turns a blank page into an organized tracking system. Before you even start punching in numbers, your setup should look something like this clean layout in Google Sheets.
From this starting point, you can build a truly powerful financial tool.
Bringing Your Worksheet to Life with Formulas
Now for the fun part—making the spreadsheet do the heavy lifting. That "Running Total" column is where we'll use a simple formula to automate your profit and loss tracking. This is how you eliminate manual calculations and the human errors that come with them.
Let's assume your "Amount" column is column E and your "Running Total" is column F.
In the very first cell of your running total (say, F2), you just need to pull in the first amount. The formula is as simple as it gets: =E2.
For the next transaction down (in cell F3), you'll want to add the new amount to the previous running total. So, the formula becomes: =F2+E3.
Once you have that second formula set, you can just click the small blue square in the corner of the cell and drag it all the way down the column. Now, every time you add a new transaction, your profit total updates instantly. It’s that easy.
The whole point is to make this process as automated as possible. A good business income worksheet should save you time and stress, not create more work. It’s about getting instant, accurate answers about your financial health.
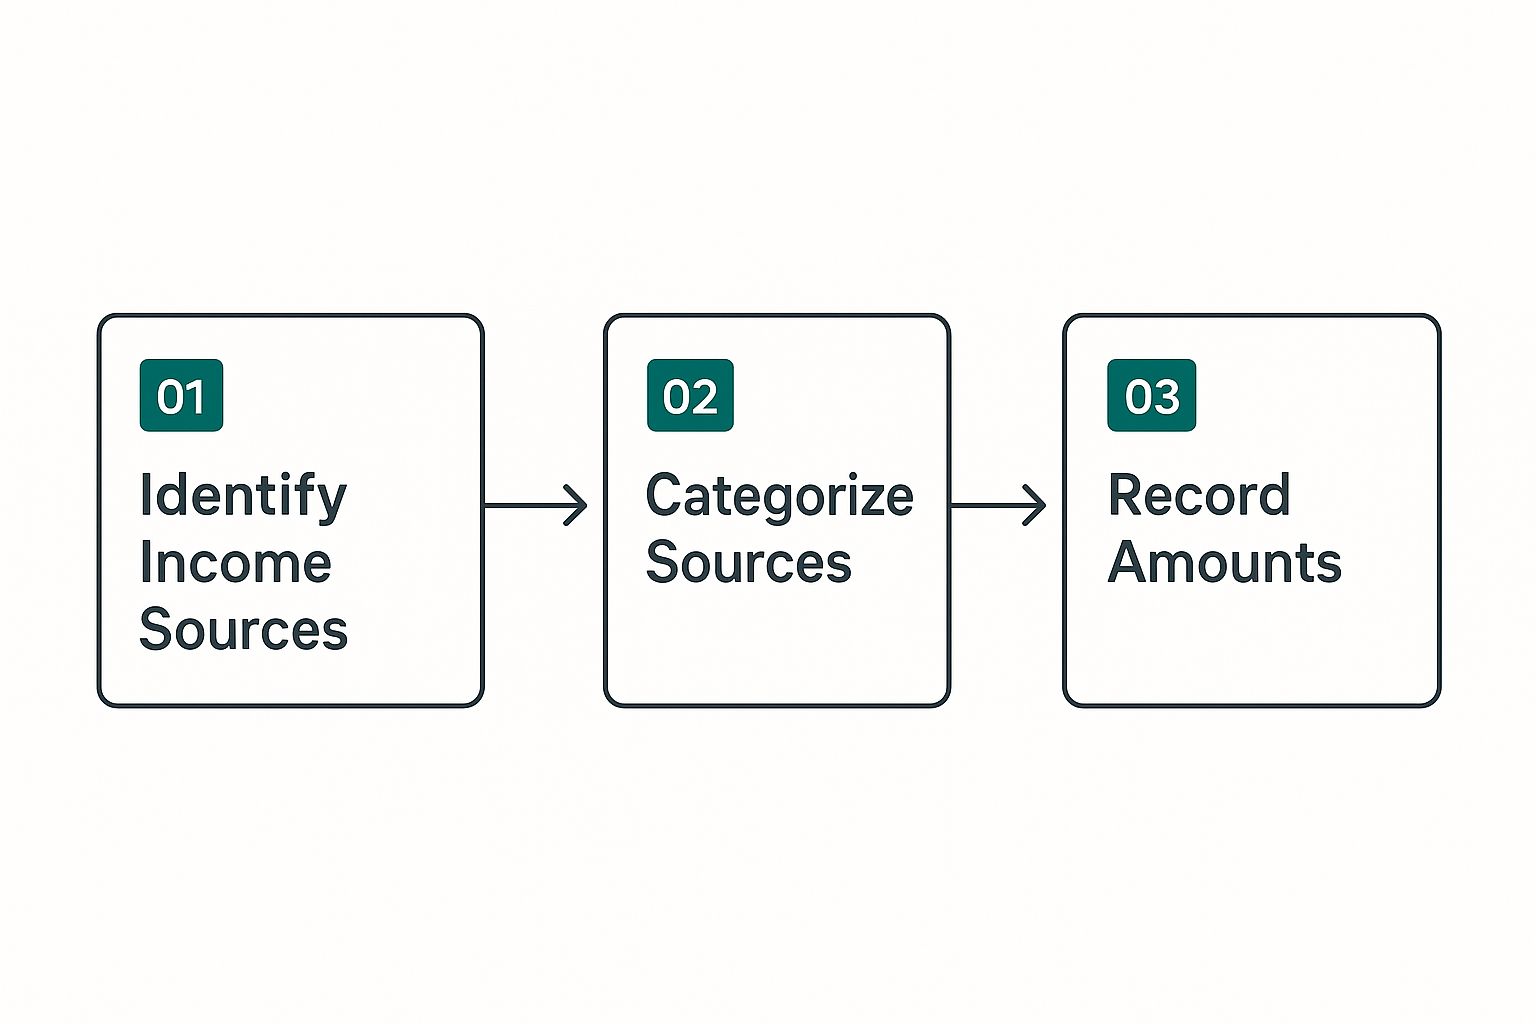
This process might feel basic, but getting the structure right from the start is what makes it so effective. Every time a dollar comes into your business, this is the simple mental checklist to follow.
By consistently following this sequence—identifying the source, categorizing it, and recording the amount—you ensure your data is clean, consistent, and genuinely useful for making smarter business decisions.
Categorizing Income and Expenses Like a Pro

A worksheet full of numbers is just a data dump. The real magic happens when you start categorizing everything in a smart, consistent way. This is the step where raw transaction logs become genuine business intelligence—the kind that actually helps you make better decisions.
To get there, you have to move beyond generic labels like "Income" and "Costs."
For example, don't just lump all your revenue into one big bucket. Split it into specific streams. A digital marketing agency I worked with started tracking "Monthly Retainers," "Project-Based Work," and "Affiliate Commissions" separately. It quickly became obvious which parts of their business were the most profitable, showing them exactly where to focus their energy.
Distinguishing Between COGS and Operating Expenses
One of the most powerful moves you can make on your business income worksheet is separating your Cost of Goods Sold (COGS) from your general Operating Expenses (OpEx). Honestly, understanding this difference is the key to calculating your true profitability.
COGS are the direct costs of creating your product or delivering your service. If you don't sell anything, you don't have these costs. Simple as that.
- For a product-based business: This is the cost of raw materials, the labor to make the product, and packaging supplies.
- For a service-based business: This might be the fee you pay a freelancer for a specific client project or the software license you bought just for one client's campaign.
Operating Expenses, on the other hand, are the costs of simply being in business, whether you make a sale or not. Think of them as the fixed overhead that keeps the lights on.
Knowing your gross profit (Revenue – COGS) before you even touch your overhead gives you an incredibly clear picture of your core business model's health. If that number is weak, no amount of penny-pinching on operating expenses will ever make the business truly thrive.
This level of detail is critical, especially if you're operating in a competitive urban area. Businesses in economic hubs like Osaka and San Francisco, for example, often juggle higher operating costs and complex regulations. According to a Statista report on global business cities, these pressures make precise financial tracking a necessity, not a luxury.
Finding Every Deductible Expense
Come tax season, your expense categories are your best friend. Getting specific here isn't just for your own insight—it's about maximizing every possible deduction. You need to think beyond the obvious and capture everything.
I've seen so many business owners leave money on the table by forgetting these crucial expense categories:
- Software & Subscriptions: Every SaaS tool, from your CRM to your design software, needs its own line item.
- Professional Development: This includes online courses, workshops, industry conferences, and even business-related books.
- Home Office Use: A percentage of your utility bills, rent or mortgage interest, and internet connection.
- Insurance Premiums: This covers everything from general liability to specific policies. Tracking these costs is also a great reminder to review your coverage. If you have a team, for instance, you can learn more about a crucial policy in our guide to liability insurance for employees.
- Bank & Payment Processor Fees: Those small transaction fees from Stripe or PayPal really add up over a year.
- Marketing & Advertising: Be sure to separate your digital ad spend from costs for print materials or promotional events.
By diligently tracking these granular expenses on your worksheet, you build an airtight record. This not only sets you up for a stress-free tax season but also gives you a true, data-backed understanding of where every single one of your dollars is going.
Your New Best Friend During Tax Season
https://www.youtube.com/embed/X25RV1mi4LU
Let's be honest, nobody enjoys that last-minute scramble for crumpled receipts and year-old invoices. Tax season can feel like a mad dash. But what if it didn't have to? An up-to-date business income worksheet completely changes the game, turning that annual ritual from a stressful mess into a surprisingly calm and orderly process.
All that work you put into tracking your finances throughout the year really shines here. Instead of spending days sifting through bank statements when your accountant asks for your numbers, you can just hand over a clean, clear summary. That feeling of being prepared and in control is priceless.
Connecting Your Categories to Tax Forms
This is where your worksheet really proves its worth. The categories you've been using all year long are designed to mirror official tax documents. The totals you've calculated for income and expenses slot right into the lines on forms like the Schedule C (Profit or Loss from Business). It’s like having a cheat sheet for your taxes.
Think of it this way: the total from your "Advertising" column goes directly on the line for advertising expenses. The money spent on "Software Subscriptions" and "Office Supplies" adds up to fill out the supplies line. It creates a simple, logical roadmap for you or your tax professional to follow.
- Gross Receipts or Sales: This is the grand total of all your income for the year.
- Cost of Goods Sold (COGS): This number comes from summing up all the direct costs tied to delivering your product or service.
- Business Expenses: Your operating costs, from rent and utilities to marketing, are all tallied up here.
- Vehicle Expenses: Every business-related trip you logged contributes to this total.
This direct alignment doesn't just make filing faster; it gives you rock-solid proof for every single deduction you claim. This is especially crucial for things like vehicle use, where detailed records are essential. If you want to dive deeper into those costs, our guide on business auto insurance cost is a great resource.
Think of your business income worksheet as your primary evidence. If you ever face an audit, this document provides a clear, transaction-by-transaction breakdown that justifies your entire tax return. That’s how you get real peace of mind.
The Bedrock of Accurate Tax Reporting
At the end of the day, this consistent tracking creates a system built on accuracy. Tax systems worldwide rely on businesses reporting their income and expenses precisely to figure out what's owed. Your income worksheet is the tool that makes this possible.
By summarizing all your revenue streams and deductible expenses in one place, you're building the very foundation for an accurate tax return. You can see how this kind of data is aggregated on a larger scale by checking out these insights on revenue statistics from the OECD.
With this discipline in place, tax time becomes less about dread and more about straightforward reporting.
Using Your Worksheet for Strategic Growth

Once you've gotten into the rhythm of tracking your day-to-day numbers, your business income worksheet stops being just a simple record book. It becomes your secret weapon for making smart, strategic decisions. This is where the magic really happens—where you find the insights that lead to real, sustainable growth.
The first move is to go beyond just tallying up totals and start digging into your profitability on a more detailed level.
Imagine a freelance web developer adding a column to calculate the profit margin for each project. After subtracting direct costs like stock photos or a premium plugin, they might see that their "E-commerce Site Builds" bring in a 40% higher margin than their "Basic Brochure Sites," even if the initial revenue looks similar. That's a game-changing piece of information. It tells them exactly where to point their marketing dollars for the biggest bang.
Identifying Trends and Spotting Issues Early
All that historical data you've been collecting? It’s a gold mine. By creating a summary tab or using pivot tables in your spreadsheet, you can start comparing performance month-over-month or quarter-over-quarter.
Are your marketing costs slowly inching up without a matching bump in revenue? Is one of your services consistently slow during a certain season? Now you can see it coming and plan for it next year.
This kind of analysis helps you catch problems before they spiral out of control. For instance, a small bakery owner might notice their cost of goods sold for specialty cakes has jumped by 15% in the last three months. This immediately triggers a closer look at their ingredient supplier's pricing, giving them a chance to renegotiate terms or tweak their menu prices before profits take a serious hit.
Your worksheet isn't just a rearview mirror showing you what happened. It's a crystal ball that helps you predict and shape the future. The data lets you be proactive and make decisions based on facts, not feelings.
This proactive mindset is crucial for building a resilient business. Catching a negative financial trend early gives you the runway to fix it, which is a cornerstone of good continuity planning. Protecting your income is just as vital as insuring your equipment, a topic we dive into in our guide on business continuity insurance.
Making Data-Driven Decisions
With these insights in hand, you can finally set financial goals that are ambitious but realistic. And more importantly, you can measure your progress against them.
Did you set a goal to grow your monthly recurring revenue by 20%? Your worksheet will show you, in black and white, exactly how you're doing. This clear view empowers you to make smarter choices everywhere in your business.
- Pricing Adjustments: If you discover a popular service has paper-thin profit margins, you now have the hard data to back up a price increase.
- Budget Allocation: You can clearly see which marketing efforts are actually bringing in customers and confidently shift your spending to what works.
- Operational Changes: When you spot costly processes or tools, it pushes you to find more efficient software or better ways of working.
In the end, your worksheet becomes less of a chore and more of an active partner, guiding your strategy with indisputable facts.
Answering Your Top Questions About Income Worksheets
As you start weaving a business income worksheet into your routine, you're bound to have questions. That’s perfectly normal—it’s a sign you’re taking your financial tracking seriously. Let's tackle some of the most common things business owners ask when they're getting started.
How Often Should I Really Be Updating This Thing?
Consistency is the name of the game here. To get the most out of your worksheet, you need data that's fresh enough to act on. I always recommend updating it at least once a week.
Many of the sharpest entrepreneurs I know make it a daily ritual. They spend just five minutes at the close of business logging the day's transactions. A weekly update is a solid minimum, though. It keeps the task manageable and prevents you from falling so far behind that catching up feels like a monumental chore.
Does This Mean I Can Ditch My Accounting Software?
For a lot of freelancers and small businesses just finding their feet, a well-organized worksheet is a fantastic, cost-effective way to stay on top of the numbers. It gives you the core tracking you need without the monthly fees of bigger software.
But, as your business grows, so does its complexity. Once you start dealing with payroll, tracking inventory, or juggling multiple bank accounts, you’ll likely need something more powerful. A dedicated platform like QuickBooks can automate tasks and provide in-depth reports that a spreadsheet just can't handle. Think of your worksheet as the perfect launchpad for your financial management journey.
A huge mistake I see people make is mixing their personal and business finances. Do yourself a favor and open a separate business bank account. It creates a clean, auditable trail that makes managing your worksheet—and your life—so much simpler.
Isn't This Just a Profit and Loss Statement?
They're cousins, but they aren't twins. A business income worksheet is your day-to-day working document. It’s the nitty-gritty, where you record every single transaction in real time.
A Profit and Loss (P&L) statement, on the other hand, is a more formal, summarized report that you create from that worksheet data. It gives you a bird's-eye view of your financial performance over a specific period, like a month or a quarter. Simply put, your worksheet is the raw material you use to build your P&L.
Another common pitfall is creating expense categories that are too vague. Don't just lump everything under "Office Expenses." Break it down into specifics like "Software Subscriptions," "Office Supplies," and "Utilities." This level of detail gives you real insight into where your money is going. It's also vital for compliance in other areas; for instance, our guide on workers compensation requirements in Florida shows just how critical precise record-keeping can be. Proper tracking and clear categories are what transform a simple spreadsheet into a powerful business tool.
At Wexford Insurance Solutions, we know that financial clarity is the bedrock of a resilient business. Our experts are ready to help you protect what you've built with the right insurance solutions. Secure your business's future with us today.
 Insurance Gap Analysis: Identify and Close Coverage Gaps10 Proven Wealth Building Strategies for 2025


