

Insurance data analytics is all about using data to make smarter decisions in the insurance world. It’s the practice of looking at information to get a much clearer picture of risk, figure out the right price for a policy, and handle claims more efficiently. In short, it turns a flood of raw data into real, usable intelligence, moving the industry from relying on historical averages to making precise, data-backed choices.
From Guesswork to Precision with Data Analytics

Think about how insurance used to work. It was a bit like trying to drive through a new city using a hand-drawn map from decades ago—you had a general idea of the layout, but the details were fuzzy. Insurers relied on broad, generalized assumptions and historical data that didn't always reflect the current reality.
Today, insurance data analytics is the equivalent of a live, high-definition GPS. It provides real-time guidance, showing the clearest, most efficient path forward.
This isn't just a minor upgrade; it's a fundamental change in how the industry operates. It moves insurers away from one-size-fits-all policies and toward incredibly accurate, individualized risk assessment. The secret isn't just about gathering more data; it's knowing how to turn data into actionable insights that drive better business outcomes. This is the engine that allows insurers to spot patterns and opportunities that were completely hidden before.
A New World of Data
The fuel for this shift comes from all sorts of new and exciting places, weaving together a rich tapestry of information. Today, insurers are pulling data from:
- Telematics and IoT Devices: Information from a car's telematics system or smart sensors in a commercial building gives a live, dynamic view of risk as it happens.
- Customer Interactions: Every click on a website, every call to a service center, and every interaction on a mobile app helps build a detailed profile of a customer's needs and behaviors.
- External Data Streams: Publicly available information, like weather forecasts, economic reports, and even social media sentiment, adds layers of valuable context to traditional risk models.
This explosion of data is driving huge investments. The global insurance analytics market was valued at around $11.47 billion in 2025 and is expected to grow at a compound annual growth rate (CAGR) of 15.9% through 2033. Much of this growth is thanks to the powerful combination of AI and machine learning.
By pulling together all these different data points into one cohesive strategy, analytics gives insurers a clear road ahead. It turns the 'what if' of potential risk into the 'what now' of proactive, confident management.
Rethinking Core Insurance Functions
This data-first approach isn't just a niche tool for analysts; it's reshaping the entire insurance value chain. From the underwriting desk to the claims department, analytics is becoming a core competency.
To understand how this all comes together, it helps to break down the key parts of a solid analytics strategy. Each component builds on the last, turning raw information into tangible business value.
Core Components of an Analytics Strategy
| Component | Description | Primary Goal |
|---|---|---|
| Data Collection | Gathering raw information from multiple sources like telematics, customer interactions, and external feeds. | Create a comprehensive and diverse data pool. |
| Data Processing | Cleaning, organizing, and structuring the collected data to make it usable for analysis. | Ensure data quality and consistency for accurate modeling. |
| Modeling & Analysis | Applying statistical models and machine learning algorithms to identify patterns, trends, and correlations. | Uncover hidden insights and predict future outcomes. |
| Actionable Insights | Translating complex analytical findings into clear, straightforward recommendations for the business. | Empower decision-makers to take specific, informed actions. |
Ultimately, this new capability creates a more responsive and intelligent insurance industry. Insurers can now get ahead of problems, personalize their services, and manage risk with a level of accuracy that was simply out of reach just a few years ago. By fully embracing data, the industry is paving the way for a smarter, more efficient future for everyone involved.
Why Analytics Is Your New Competitive Edge

In a crowded market, just sticking to the old ways of doing things won't cut it anymore. Embracing insurance data analytics isn't just a fancy upgrade; it's become a fundamental part of staying relevant and growing. This isn't about chasing the latest trend—it’s about carving out a real, measurable advantage over competitors who are too slow to change.
The true power of analytics lies in its ability to translate mountains of raw data into smart business decisions. By moving beyond gut feelings and outdated historical averages, insurers can operate with a whole new level of precision. The results show up in three key areas: razor-sharp risk assessment, personalized customer experiences, and incredibly efficient operations.
This shift is making serious waves economically. The global insurance analytics market was valued at $15.33 billion in 2024 and is expected to explode to $51.45 billion by 2033. This massive growth highlights just how much the industry is relying on data to sharpen underwriting, slash fraud, and manage claims better.
Achieving Pinpoint Risk Assessment
One of the first and most powerful wins from insurance data analytics is the ability to price policies with astonishing accuracy. Old-school models lumped policyholders into huge, generic buckets. Today, we can use granular data to see a much clearer, more nuanced picture of individual risk.
Instead of a one-size-fits-all premium, analytics allows for a dynamic, living evaluation of risk. Think about it: telematics data from a commercial truck can show a driver consistently avoids speeding and hard braking. This proves they are a lower risk and justifies a lower premium. This detail helps insurers offer better prices to great clients while accurately pricing policies for those with more exposure. You can learn more about this in our guide on the link between risk and analytics.
By analyzing specific behaviors and real-world conditions, insurers can move from generalized assumptions to data-driven certainty. This precision not only protects profitability but also attracts and retains the most desirable customers.
Creating Personalized Customer Journeys
Today’s customers expect everything to be tailored to them, and insurance is no different. Analytics gives insurers the tools to understand and even predict what a policyholder needs. This is the secret to building loyalty and stopping customers from walking away.
By digging into customer interaction data—from clicks on a website to notes from a call center—insurers can map out the entire customer lifecycle. This insight allows them to be proactive, not reactive.
- Anticipating Needs: Predictive models can flag policyholders who are likely to shop around for a new carrier, giving retention teams a chance to step in with a better offer or improved service.
- Tailored Product Offers: Data can signal major life events, like buying a new home or starting a business. This is the perfect time to offer relevant, timely coverage.
- Effortless Interactions: When you understand a customer’s history, you can make every interaction smoother—whether they're filing a claim or just asking a question.
This focus on the individual builds a much stronger connection, turning a policyholder from a number on a spreadsheet into a genuinely valued partner.
Streamlining Operations for a Better ROI
Beyond pricing and marketing, insurance data analytics drives huge efficiency gains right where it counts: in core operations like claims and fraud detection. These improvements directly boost the bottom line and create a much more resilient business.
Machine learning algorithms can scan incoming claims in real-time, catching suspicious patterns a human adjuster might never see. This helps shut down fraudulent payouts, which have always been a massive drain on the industry.
Analytics also automates countless routine tasks in claims management. This frees up adjusters to handle the truly complex cases that require a human touch. The result? Faster claim settlements—a huge factor in customer happiness—and dramatically lower operating costs. If you want to dig deeper into the numbers, there are great resources on proving the ROI of business intelligence. It becomes clear that investing in analytics is a powerful engine for long-term profit.
Seeing Insurance Analytics in the Real World

The theory behind insurance data analytics is interesting, but its real power comes to life when you see it in action. This is the point where data sheds its skin as mere numbers on a spreadsheet and becomes a practical tool that actively prevents losses, tailors services to individuals, and builds a stronger, more reliable insurance industry. These aren't just ideas for the future; these applications are happening right now, changing the business from the inside out.
Let’s think about a large commercial property, like a sprawling warehouse. Traditionally, its insurance premium would be calculated based on broad historical data—what’s happened to similar buildings in the same zip code. But today, that same building can be outfitted with Internet of Things (IoT) sensors that monitor everything in real time.
These tiny sensors feed a constant stream of live information back to the insurer. A water pressure sensor might detect a slow leak long before it can cause a catastrophic flood. A temperature sensor could flag an overheating HVAC unit, giving maintenance a chance to prevent a fire. This isn't about looking backward anymore; it's about dynamic, real-time risk management that turns a static policy into a living agreement reflecting the actual, current risk.
Preventing Fraud Before It Happens
Fraud has always been a massive thorn in the industry's side, and it ultimately drives up premiums for everyone. Even the most experienced human adjuster can only review so many claims and might miss the subtle clues of a coordinated fraud ring. This is where artificial intelligence and machine learning completely change the game.
AI models can sift through thousands of claims in seconds, hunting for anomalies and suspicious connections that are practically invisible to the human eye.
- Pattern Recognition: An AI can instantly spot if the same doctor, auto shop, or lawyer is connected to a cluster of suspiciously similar accident claims.
- Text Mining: The system can scan the text in claim descriptions, flagging inconsistencies or specific phrases that are common red flags for fraud.
- Image Analysis: Advanced algorithms can even analyze photos of vehicle damage to see if the exact same damage has been claimed in a past incident.
By flagging these questionable claims for human review, insurers can stop fraud dead in its tracks. This not only saves immense amounts of money but also frees up resources to process legitimate claims faster, making things better for honest policyholders.
The goal of insurance data analytics isn't to replace human expertise but to augment it. It acts as a powerful assistant, highlighting the cases that need a closer look so that human experts can apply their judgment where it matters most.
Personalizing Policies and Retaining Customers
Analytics is also completely changing how insurers engage with their customers. By analyzing a customer’s digital interactions—always with their permission—insurers can spot key life events and offer the right product at exactly the right time.
For example, data might show that a long-time auto insurance client has recently started browsing real estate listings. This is the perfect opportunity to proactively offer a personalized home insurance bundle. The insurer is no longer just a passive company waiting for a phone call; they've become a helpful partner who anticipates needs. This is a core focus in modern data analytics for insurance because it builds deeper, more loyal customer relationships.
This proactive mindset is also crucial for customer retention. Predictive models can identify policyholders who are at a high risk of jumping ship to a competitor. These models look at factors like recent rate hikes, claim satisfaction scores, and even how often a customer logs into their online portal.
When the system flags a customer as a "churn risk," the retention team can step in. They might offer a loyalty discount, a policy review to find new savings, or just make a personal call to make sure the customer feels valued. This targeted, data-backed strategy is far more effective—and much less expensive—than blasting out generic marketing campaigns to everyone. These real-world examples show how analytics creates a smarter, more responsive, and more secure insurance environment for everyone involved.
Understanding the Four Levels of Analytics
To really get a handle on insurance data analytics, it's helpful to stop thinking of it as one big, complicated thing. Instead, picture it as a ladder. Each rung you climb answers a more sophisticated question, delivering more and more value to your business.
A visit to the doctor is a great way to understand this. You start with the basics and progressively dig deeper to find not just a diagnosis, but a full-blown treatment plan. This same journey—from simply reacting to the past to actively shaping the future—is exactly what data analytics helps an insurer accomplish.
Level 1: Descriptive Analytics
This is the first and most fundamental rung of the ladder. It’s all about answering a simple question: "What happened?"
Think of this as the initial check-in at the doctor's office. The nurse takes your vitals—blood pressure, temperature, and so on. This raw data doesn't tell you why you feel sick, but it gives everyone a factual, easy-to-understand snapshot of your current state.
In the insurance world, this looks like a dashboard showing the total claims filed last quarter. Or maybe it's a report detailing how many new auto policies were sold in Texas. Descriptive analytics is all about summarizing historical data to get a clear picture of what's already taken place. It’s the essential foundation for any deeper analysis.
Level 2: Diagnostic Analytics
Once you know what happened, the next logical step is to figure out "Why did it happen?" This is where diagnostic analytics comes in.
Back at the doctor’s office, if your blood pressure is high, the doctor doesn't just make a note of it and send you home. They start digging. "Have you been eating a lot of salty food? Feeling more stressed than usual?" They're searching for the root cause behind that initial data point.
For an insurer, this means drilling down into the "what." Let's say claims spiked last quarter (the descriptive finding). Diagnostic analytics might uncover that the entire increase was driven by a single, massive hailstorm in Colorado. This type of analysis connects the dots, turning raw information into a story with context.
Key Insight: Moving from descriptive to diagnostic analytics is like shifting from seeing a symptom to understanding the illness. It's the critical step where data starts telling a story and pointing toward a solution.
Level 3: Predictive Analytics
The third level, predictive analytics, takes a huge leap forward by asking, "What is likely to happen next?"
Now, the doctor is giving you a prognosis. Based on your lab results and family history, they might predict your risk of developing heart disease if you don't make some lifestyle changes. It’s not a crystal ball, but it’s a smart forecast based on data and established patterns.
This is where insurance data analytics gets incredibly powerful. Predictive models can:
- Forecast future loss ratios for a commercial property line.
- Identify which policyholders are most likely to file a major claim in the next six months.
- Pinpoint which customers are at the highest risk of switching to a competitor at renewal.
This allows insurers to get ahead of events instead of just cleaning up after them. Of course, the quality of these predictions hinges entirely on the quality of the data used, as the infographic below shows.
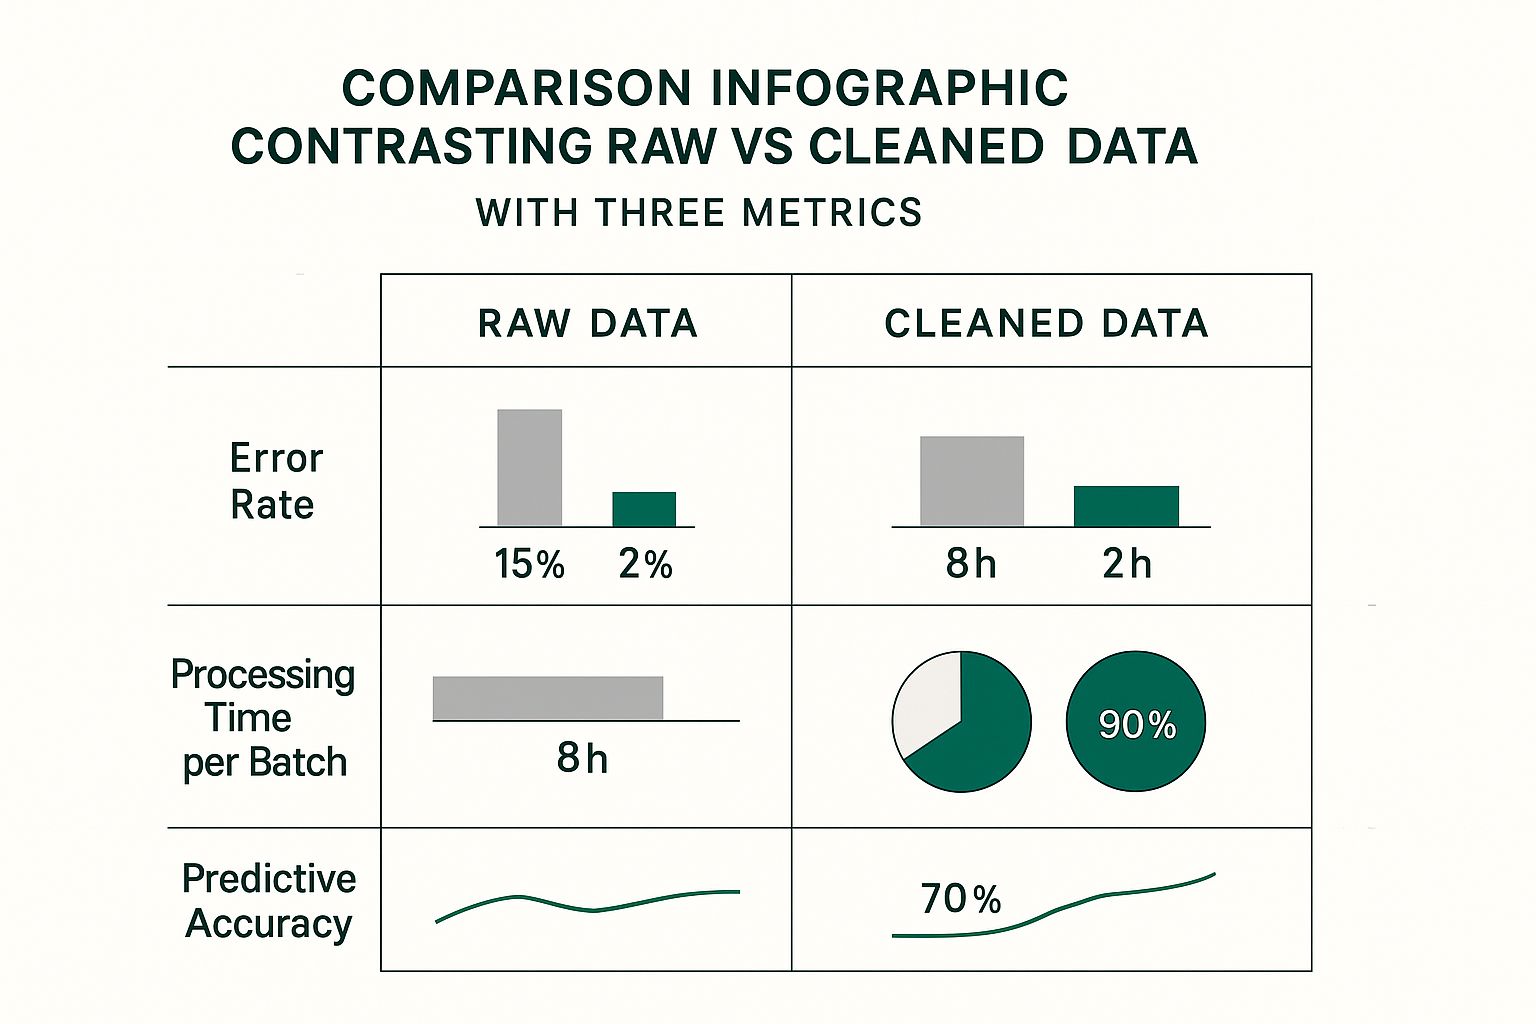
As you can see, clean, well-organized data doesn't just speed things up—it's the bedrock of accurate and reliable predictive models.
Level 4: Prescriptive Analytics
Finally, we arrive at the top of the ladder: prescriptive analytics. It answers the ultimate, most valuable question: "What should we do about it?"
This is the doctor handing you a prescription or laying out a detailed treatment plan. It’s not just a forecast; it’s a specific, actionable recommendation designed to create the best possible outcome.
In an insurance setting, prescriptive analytics offers clear, data-driven directions. It might suggest the precise premium adjustment needed for a high-risk group to ensure profitability. It could recommend proactive outreach to a customer whose behavior flags them as a churn risk. It might even determine the optimal settlement offer for a complex claim to sidestep expensive litigation. It takes the guesswork out of decision-making by providing a clear, data-supported path forward.
Comparing Types of Insurance Analytics
To tie it all together, here’s a simple table breaking down the four types of analytics. It clearly shows how each level builds on the last, answering progressively more complex questions to deliver greater business value.
| Analytics Type | Core Question Answered | Insurance Example |
|---|---|---|
| Descriptive | What happened? | A dashboard shows a 15% increase in auto claims in Q3. |
| Diagnostic | Why did it happen? | Drilling down reveals the spike was caused by two major hurricanes. |
| Predictive | What will happen next? | A model forecasts a 10% rise in similar claims for the next Q3. |
| Prescriptive | What should we do? | The system recommends a targeted premium increase of 3% for coastal areas. |
As you can see, the journey from descriptive to prescriptive analytics is one of increasing sophistication and impact, moving an organization from being reactive to truly proactive.
How to Build Your Analytics Capabilities
So, you see the power of insurance data analytics. Now what? Making the leap from understanding its potential to actually putting it to work requires a solid plan. Building a strong analytics engine isn't as simple as buying new software; it's about weaving together three crucial components: the right technology, the right people, and a supportive, data-first culture.
Think of it like building a high-performance race car. The technology is the engine and chassis—the core machinery. The talent is the skilled driver and pit crew who know how to get the most out of it. And the culture? That's the entire team's shared belief that speed, precision, and constant improvement are the only ways to win. If you neglect any one of these, you’ll find yourself watching the competition pull away.
The Technology Foundation
First things first, you need the right tech stack. This is the backbone of your entire analytics operation. The goal isn’t to chase every shiny new tool, but to build a cohesive infrastructure that can reliably collect, store, process, and visualize your data.
Your technology needs really boil down to a few key areas:
- Data Infrastructure: This is where all your raw information lives. Modern setups often use a mix of a data warehouse (perfect for structured data like policy details) and a data lake (for unstructured data like emails, claim notes, or social media chatter).
- Cloud Platforms: Cloud services from providers like AWS, Azure, or Google Cloud are pretty much non-negotiable these days. They give you scalable storage and serious computing power without the massive upfront cost of buying and maintaining physical servers.
- Analytics Tools: This category covers everything from business intelligence (BI) platforms for creating dashboards to the sophisticated machine learning environments where data scientists build predictive models.
Choosing the right technology is one of the most critical insurance industry technology trends to master, as it directly determines how well you can scale your efforts and adapt down the road.
The Talent and Team Structure
Having the best tools in the world won't do you any good if no one knows how to use them. Assembling a capable team is the second—and arguably most important—pillar of your analytics strategy. This means more than just hiring a couple of data scientists.
A truly effective team has a mix of specialists, each playing a vital role:
- Data Scientists: These are your model builders. They dive deep into the numbers, using statistics and machine learning to find hidden patterns and forecast future events, answering questions like, "Which customers are at the highest risk of lapsing?"
- Data Analysts: Think of analysts as your storytellers. They take the complex findings from the data scientists and translate them into clear charts, reports, and dashboards that business leaders can actually use to make smart decisions.
- Business Translators: This is a crucial and often overlooked role. These folks are fluent in both the language of business and the language of data. They act as the bridge, making sure the analytics team is solving real business problems and that executives fully grasp what the numbers are telling them.
As you begin to build out your team, this Guide to Building an AI Team for Business is a fantastic resource for structuring your team for success.
Fostering a Data-Driven Culture
The final pillar is culture, and frankly, it's the glue that holds everything else together. A data-driven culture is one where decisions, from the C-suite all the way to the front lines, are guided by evidence and insights—not just gut feelings or the way things have always been done. This is often the toughest part of the journey.
Building this culture means shifting the entire organization's mindset. It requires moving from "We've always done it this way" to "What does the data tell us?" This change has to be championed from the top down.
Getting buy-in from every department is non-negotiable. When leaders consistently use data to back up their decisions, it sends a powerful message across the company. It encourages everyone to ground their own arguments in evidence, creating an environment where data is treated as a shared asset for winning.
The investment in this area is significant, reflecting the market’s direction. The United States represents a massive and fast-growing piece of the insurance analytics market, valued at $15.4 billion in 2024 and projected to hit an incredible $59.8 billion by 2033. This explosive growth is fueled by the urgent need to turn oceans of data into smart, actionable intelligence—a process that simply can't happen without a strong data culture.
The Future of Data-Powered Insurance
The world of insurance data analytics isn't standing still; it's rocketing toward a future that looks almost nothing like the one we know today. When we look just over the horizon, the changes coming promise to make insurance more personal, more immediate, and far more intelligent. This isn't just about tweaking old processes—it's about completely reinventing the relationship between an insurer and its customers.
The next giant leap forward is hyper-personalization. Picture an insurance policy that acts like a living contract, adjusting itself in real time. For a commercial trucking fleet, this could mean premiums that go up or down based on live telematics data, instantly rewarding drivers for safe habits. For a homeowner, it could be smart home sensors that don't just alert you to a water leak but also automatically adjust your policy premium downward once the repair is confirmed, reflecting the lower risk.
The Rise of Generative AI
Working hand-in-hand with hyper-personalization, generative AI is poised to change everything from customer service to core operations. This isn't just about analyzing existing data; it’s about creating entirely new content and solutions on the fly.
-
Intelligent Claims Assistance: Imagine a customer interacting with an AI claims assistant that doesn't just process their information, but also offers genuine, human-like guidance. It could proactively line up a rental car or schedule a repair contractor without the customer ever having to ask.
-
Proactive Risk Consulting: Generative AI could comb through a company's operational data and create a detailed risk mitigation report. This report wouldn't just be data—it would offer actionable advice and even simulate the financial fallout from potential disasters. Our analysis of business interruption insurance cost offers more context on just how critical this kind of planning can be.
-
Dynamic Policy Creation: Instead of picking from a limited menu of coverage options, a customer could work with a generative AI tool to draft a completely custom policy from the ground up, tailored perfectly to their specific risks and needs.
Navigating the Ethical Frontier
Of course, this incredible power brings with it some serious responsibilities. As we push the limits of what insurance data analytics can achieve, we have to face some tough ethical questions head-on. The same data that allows for incredible personalization also brings up valid concerns about privacy and fairness.
With great data comes great responsibility. The future of insurance hinges not just on technological capability, but on the industry's commitment to using that capability ethically, ensuring fairness and protecting consumer trust.
Insurers have to be completely transparent about how customer data is used. More importantly, they must ensure their algorithms are free from hidden biases that might unfairly penalize certain groups of people. In a world powered by data, trust will be the single most valuable asset an insurer can have.
Ultimately, adopting analytics is no longer a simple tech upgrade—it's a full-scale business transformation. The insurance companies that will lead the pack in the years ahead will be the ones that see data not just as a way to cut costs, but as the very heart of their strategy. It's how they'll deliver real value, build lasting relationships, and manage risk with a level of precision we've never seen before. The future truly belongs to the data-driven.
Frequently Asked Questions
Even when you see the potential, putting insurance data analytics into practice naturally raises some questions. Let's tackle a few of the most common ones to clear up how this works in the real world and what challenges you can expect.
What Is the Biggest Challenge in Implementation?
You might think it’s the technology, but it’s almost always the culture. The single biggest hurdle is getting an entire organization to shift from a traditional, gut-feel way of doing things to a mindset that truly trusts and acts on data. This is a massive cultural change.
This kind of shift has to be driven from the top down, with real commitment from leadership and dedicated training. Success often hinges on finding or developing people who can be translators—those who can take complex data findings and turn them into clear, actionable strategies that the rest of the team can get behind.
The toughest part of an analytics transformation isn't installing software; it's changing minds. It's about moving from "this is how we've always done it" to "what does the data tell us is the best way to do it?"
How Does Data Analytics Improve the Customer Experience?
In short, analytics helps insurers get ahead of the curve. Instead of just reacting when something happens, they can anticipate what customers need and create a much smoother, more personal experience. For instance, data can help automate and speed up the claims process, getting money into a customer's hands faster.
It also opens the door for genuinely personal interactions. By understanding a customer's specific situation and what they might need next, an insurer can offer relevant help at just the right moment—like suggesting a rental car service right after an auto accident is reported. The customer ends up feeling understood and cared for, not just like another policy number.
Can Small Insurance Companies Benefit from Data Analytics?
Absolutely. You don't need the budget of a global giant to see real benefits. Modern cloud-based tools and specialized platforms have leveled the playing field, making powerful analytics affordable without a huge upfront investment in your own servers.
The trick for smaller firms is to start with a specific, focused goal. A smaller agency could, for example, concentrate on sharpening its underwriting for a niche market, like offering better management liability coverage for startups. Or maybe the focus is on fine-tuning the claims process to cut down on costs. These targeted projects deliver a strong return on investment and build the confidence to expand later on.
Ready to see how a modern approach to insurance can protect your assets and simplify your life? The team at Wexford Insurance Solutions combines expert guidance with powerful technology to deliver peace of mind. Get in touch with us today.
 Errors and Omissions Insurance for Consultants | Complete GuideUnderstand the Cost of Airplane Insurance | Tips & Insights


